I wrote an open-source app called NBA Shots DB that uses the NBA Stats API to populate a database with all 4.5 million shots attempted in NBA games since 1996. The app also processes a dataset provided by Sportradar of over 1 million NCAA men’s shot attempts since 2013 into a format that can be merged with the NBA data. Both datasets include similar information: location coordinates, player and team names, which shots went in, and so on. The merged dataset allows us to compare NBA and NCAA shot patterns on the same scale, and even allows tracking individual players as they move from college to the pros.
Shot data has some significant limitations, and we should be very wary of drawing unjustified conclusions from it, but it can also help illuminate trends that might not be otherwise obvious to the human eye.
NBA players shoot better than college players from distance, but college players appear to be more accurate closer to the rim
The NBA’s aggregate field goal percentage is slightly better than the NCAA’s, 46% to 44%. I would have guessed that NBA professionals would be better shooters than NCAA players at all distances, but it turns out that for shots under 6 feet, NCAA attempts are more likely to go in. The shot data can’t tell us why—my guess is that the NCAA has more mismatches where an offensive player is much bigger than his defender, leading to easier interior shots, but we don’t really know.

An important disclaimer: neither dataset is particularly clear about where its data comes from. The NBA data is presumably generated by the SportVU camera systems installed at NBA arenas, but I don’t know how Sportradar produces the NCAA data. It could come from cameras, manual review of game tape, or something else. If the systems that gather the data are different enough, it might make comparisons less meaningful.
For example, it seems a bit odd that the NBA data reports a much higher frequency of shots less than 1 foot from the basket. It makes me think the measurement systems might be different, and maybe what’s recorded as a “1 foot” shot in the NBA is recorded as a “3 foot” shot in the NCAA. If we restrict to all shots under 6 feet in each dataset, the NCAA still has a slightly higher FG% than the NBA (59% vs. 58%), but depending on how the recording systems work, the accuracy gap at short distances might be significantly smaller than the graph would have you believe.
Scouting the college players who shoot the best from NBA 3-point range
The college 3-point line is 3 feet closer to the basket than the NBA line in most places, though the gap narrows to 1.25 feet in the corners. But of course there’s nothing to stop a college player from shooting from NBA 3-point range, and NBA scouts might be particularly interested in how college players shoot from NBA-range as a predictor of future pro performance.
I used the Sportradar NCAA data to isolate shots that were not only 3-pointers, but would have been 3-pointers even in the NBA, then ranked college players by their NBA-range 3-point accuracy. Here’s a list of NCAA players who attempted at least 100 NBA-range 3-pointers since 2013:
Unfortunately for any aspiring scouts, it looks like this might not be a good predictor of future NBA performance. Based on the 23 players in the dataset who attempted at least 100 NBA-range 3-pointers in college and another 100 3-pointers in the NBA, there’s no strong correlation between college and pro results. Most of the players had lower accuracy in the NBA than in college, though Terry Rozier of Louisville and the Boston Celtics managed to improve his NBA-range 3-point shooting by +9%.
Adjusted for shot distance, players typically shoot worse during their NBA rookie season than they did during their final college season
There are many competing factors that might influence field goal accuracy when a player transitions from college to the pros. Players presumably get better with age in their early 20s as they mature physically, NBA players probably practice more, and have access to better training facilities and coaching, all of which suggest they might shoot better in their first professional season than they did in college. On the other hand, NBA rookies have to play against other NBA players, who are on average much better defenders than their previous college opponents.
We’ve seen anecdotally with 3-point attempts that an individual player usually shoots worse in the NBA than he did in college, but I wanted to do something at least a bit more scientific to quantify the effect. Using a dataset of 129,000 shots from 262 players who appear in both datasets, I ran a logistic regression to estimate the change in field goal accuracy associated with the transition from college to the NBA. It’s a crude model, considering shot distance, whether the player is in his final year of college or his first year in the NBA, and a player-level adjustment for each player. The model ignores any differences between positions, so if guards and centers are affected differently, the model would probably miss it.
The simple model predicts that, on average, as a player goes from his last year in college to his first year in the NBA, his field goal percentage will decline by around 4% on shots over 6 feet, and as much as 15% on shorter shots. It doesn’t say anything about why, though again I’d suspect the primary explanation is that NBA players are much better defenders.

At first glance, this result that players shoot worse when they go from college to the NBA might seem in conflict with the first chart in this post, which showed that NBA players had higher field goal percentages on longer shots than college players. The most likely explanation is that rookies are below-average shooters among all NBA players, and as rookies turn into veterans, their shooting performance improves. Note that the merged NBA/NCAA dataset has a data truncation issue: because the NCAA data only spans 2013–18, any player who was in both leagues during that period has at most 4 years of NBA experience. Over time, assuming both datasets remain publicly available, it will be interesting to see if there is an NBA experience level where a player’s shooting performance is expected to exceed his college stats.
In the NBA, a wide-open mid-range 2 can be a better shot than a well-guarded 3
Even the most casual basketball fan probably knows by now that 3-point attempts have exploded in popularity, while mid-range 2-point attempts are in decline. It’s gotten to the point where there are some signs of blowback, but overall the trend continues.

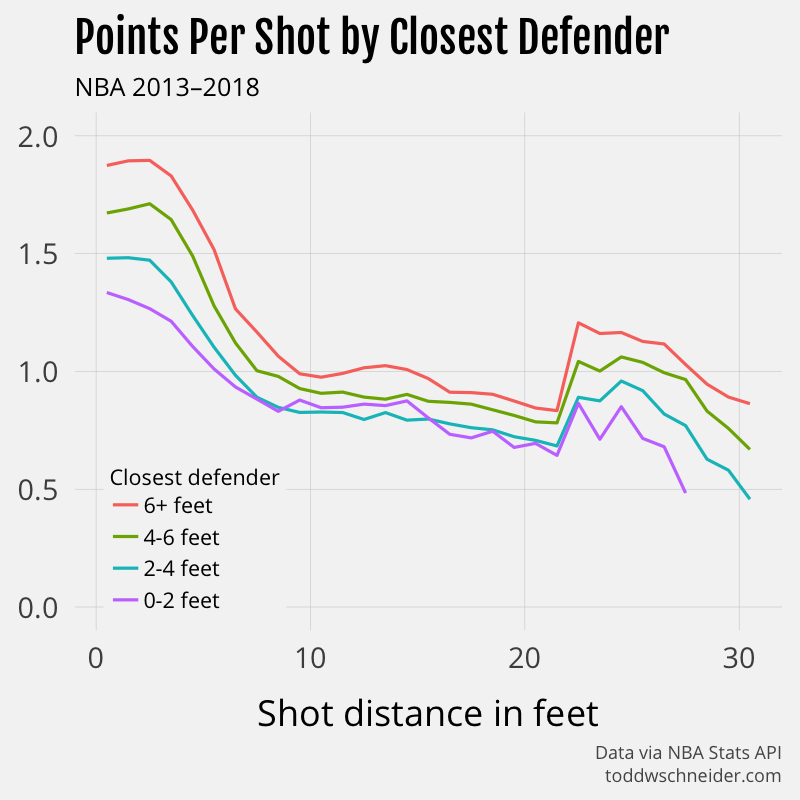
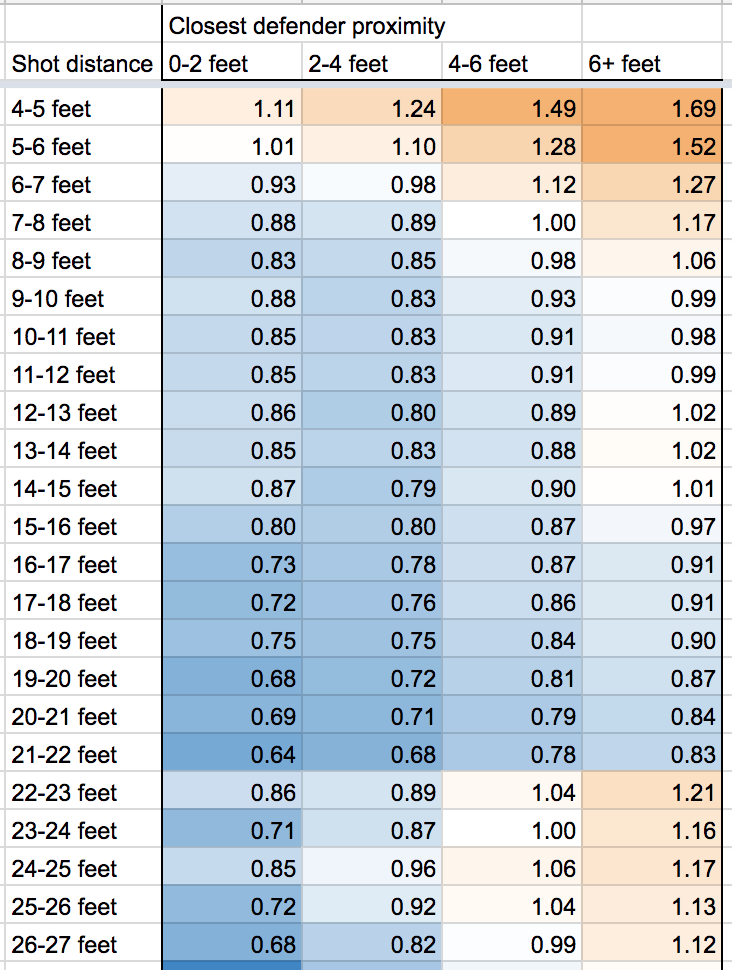
The NBA Stats API provides some aggregate data on shooting performance based on both the distance of the shot, and the distance of the closest defender at the time of the shot, which shows that yes, usually a 3-point attempt has a higher expected value than a long-range 2. But if the 3-pointer is tightly guarded and the long-range 2 is wide-open, then the 2-pointer can be better. For example, a wide-open 2-point shot from 20 feet on average results in 0.84 points, while a tightly-guarded 3-point attempt from 25 feet only averages 0.71 points.
The same table, in graph form:

Again, basketball is complicated and these isolated data points are not a final authority on what constitutes a good or bad shot. In the 2017-18 season, the Houston Rockets and Indiana Pacers have both been successful even though they are at opposite ends of the shooting spectrum, with the Rockets shooting the most 3s, and the Pacers shooting the most long-distance 2s. To be fair, the 3-point-happy Rockets currently have the best record in the league, but the Pacers’ success, despite taking the most supposedly “bad” mid-range 2s of any team in the league, suggests that there’s more than one way to win a basketball game.
Another important note: for unknown reasons, the aggregate stats by distance and closest defender do not match the aggregates computed from the individual shot-level data. The shot-level data includes more attempts, which makes me think that the aggregates by closest defender are somehow incomplete, but I wasn’t able to find more information about why. The difference is particularly pronounced in shots of around 4 feet, with the shot-level data reporting a significantly lower FG% than the aggregate data.
Code on GitHub, future work
The code used to compile and analyze all of the NBA and NCAA shots is available here on GitHub. The NBA Stats API has many more (mostly undocumented) endpoints, and the code could probably be expanded to capture more information that could feed into more detailed analysis.
Every so often I see a story about whether or not the hot-hand exists, and though I kind of doubt that debate will ever be settled conclusively, maybe the shot-collecting code can be of use to future researchers.
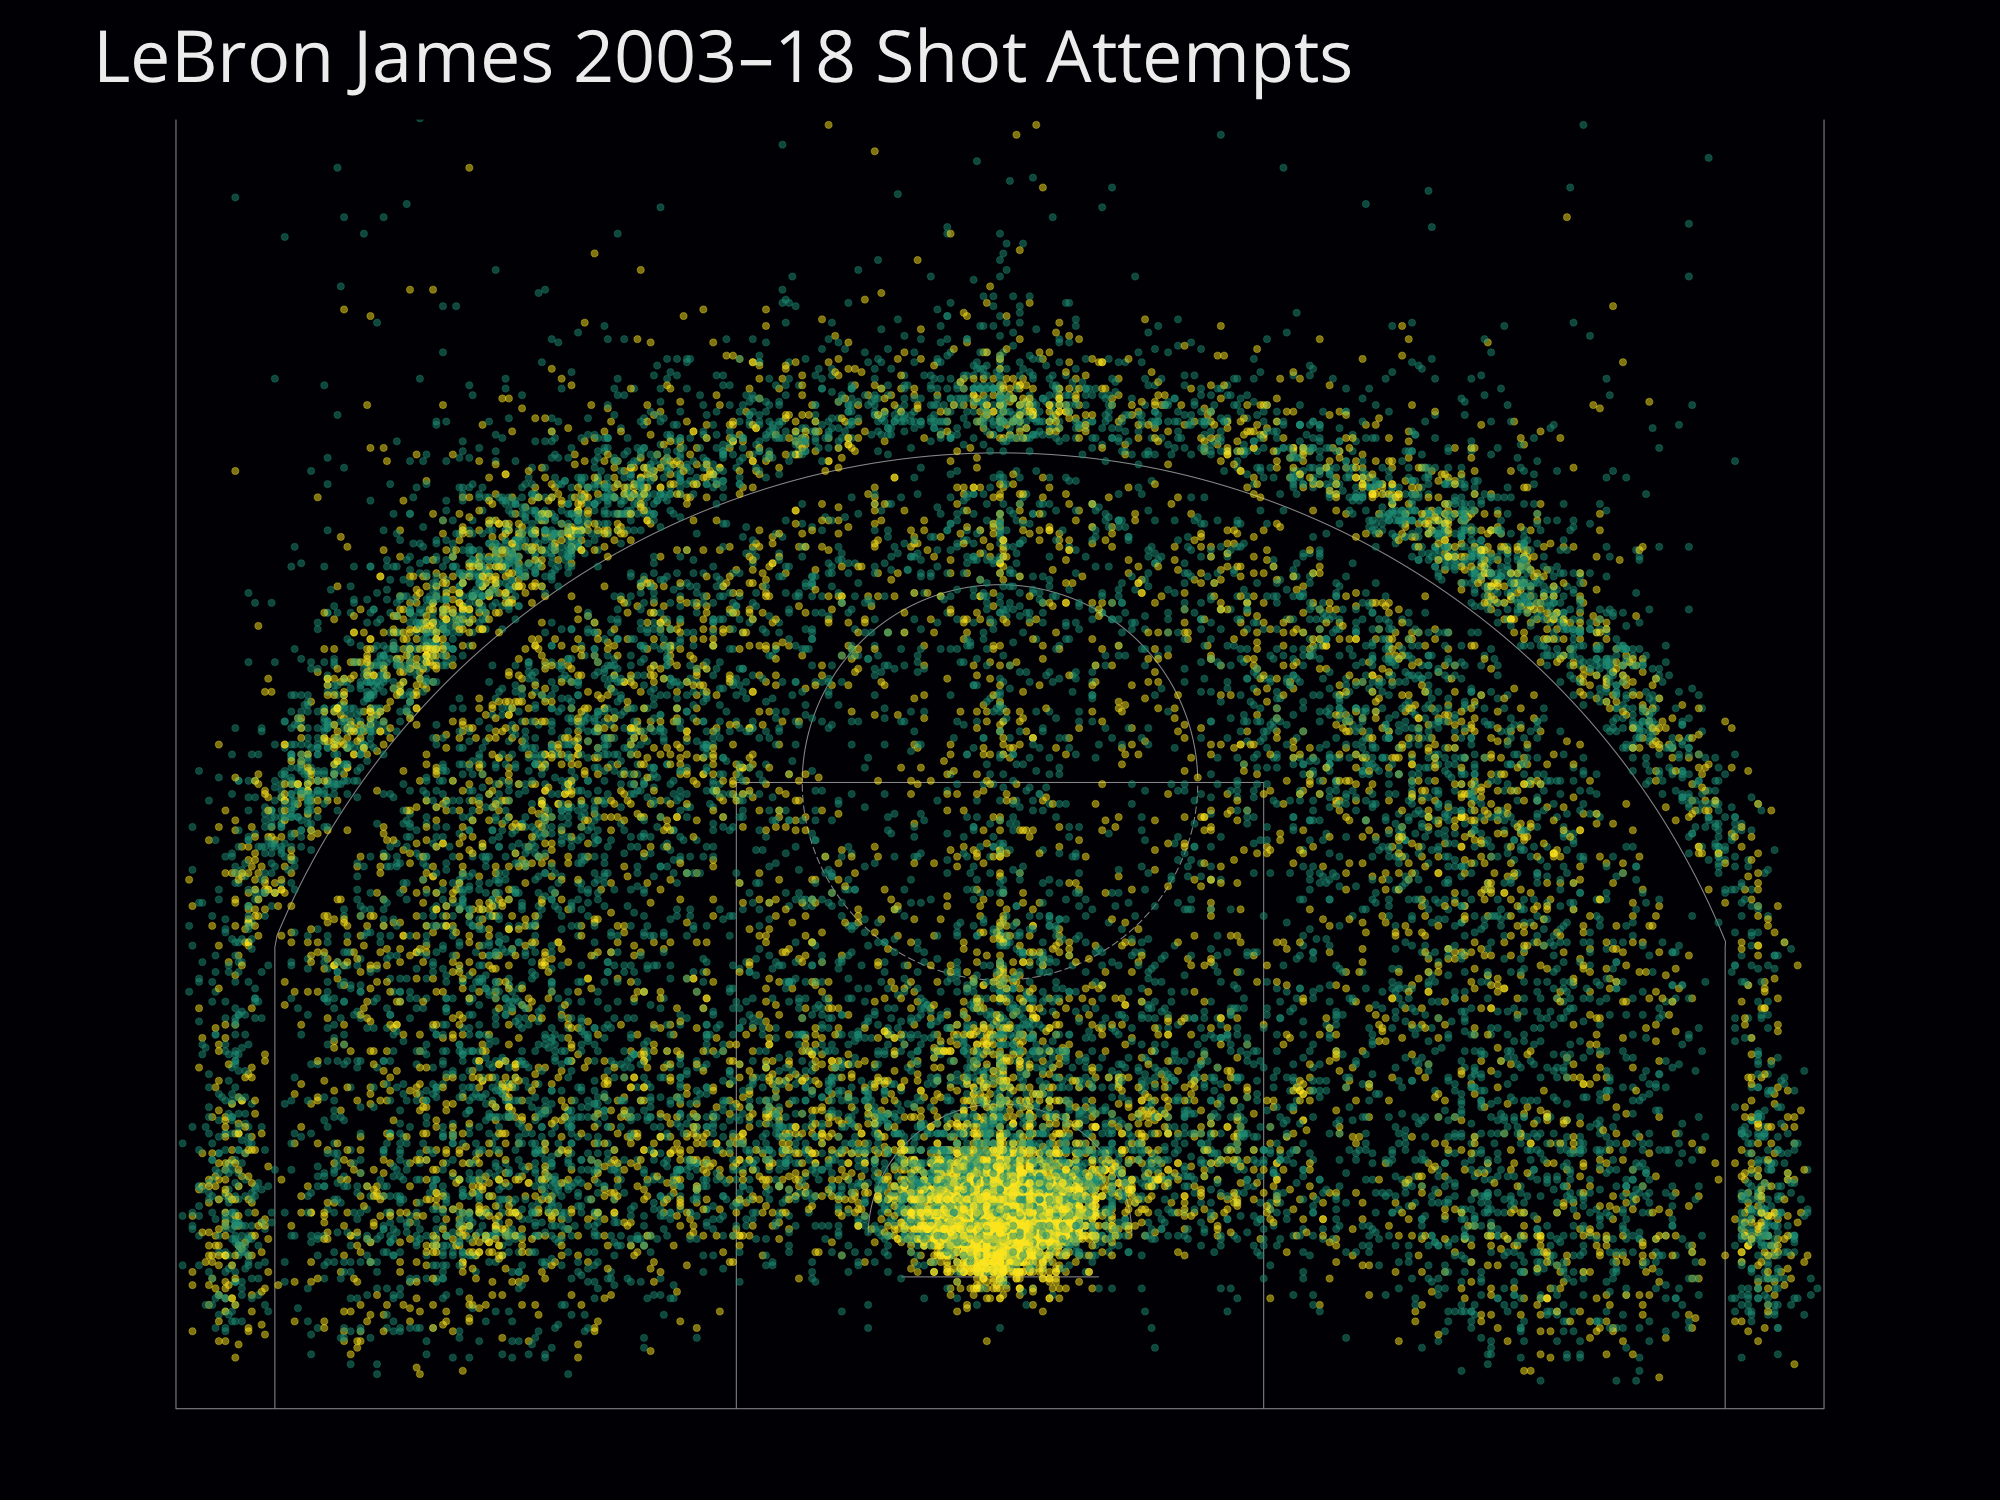
The Los Angeles Times made a nice graphic of all 30,000+ shots Kobe Bryant ever attempted in the NBA, and you could use the data in NBA Shots DB to do something similar for any NBA player since 1996. Here’s an image of every shot LeBron James has attempted during his NBA career:
Or you could do a team-level analysis, for example comparing the aforementioned Houston Rockets (lots of 3-pointers) to the Indiana Pacers (lots of mid-range 2-pointers):
These images use an adapted version of my BallR shot chart app, but a better solution would be to expose an API from the NBA Shots DB app, then have BallR connect to that API instead of hitting the NBA Stats API directly.


