LearnedLeague bills itself as “the greatest web-based trivia league in all of civilized earth.” Having been fortunate enough to partake in the past 3 seasons, I’m inclined to agree.
LearnedLeague players, known as “LLamas”, answer trivia questions drawn from 18 assorted categories, and one of the many neat things about LearnedLeague is that it provides detailed statistics into your performance by category. Personally I was surprised at how quickly my own stats began to paint a startlingly accurate picture of my trivia knowledge: strength in math, business, sports, and geography, coupled with weakness in classical music, art, and literature. Here are my stats through 3 seasons of LearnedLeague play:
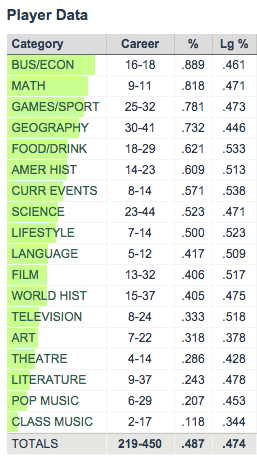
My personal category stats through 3 seasons of LearnedLeague. The “Lg%” column represents the average correct % for all LearnedLeague players, who are known colloquially as “LLamas”
It stands to reason that performance in some of these categories should be correlated. For example, people who are good at TV trivia are probably likely to be better than average at movie trivia, so we’d expect a positive correlation between performance in the TV and film categories. It’s harder to guess at what categories might be negatively correlated. Maybe some of the more scholarly pursuits, like art and literature, would be negatively correlated with some of the more, er, plebeian categories like popular music and food/drink?
With the LearnedLeague Commissioner’s approval, I collected aggregate category stats for all recently active LLamas so that I could investigate correlations between category performance and look for other interesting trends. My dataset and code are all available on GitHub, though profile names have been anonymized.
Correlated categories
I analyzed a total of 2,689 players, representing active LLamas who have answered at least 400 total questions. Each player has 19 associated numbers: a correct rate for each of the 18 categories, plus an overall correct rate. For each of the 153 pairs of categories, I calculated the correlation coefficient between player performance in those categories.
The pairs with the highest correlation were:
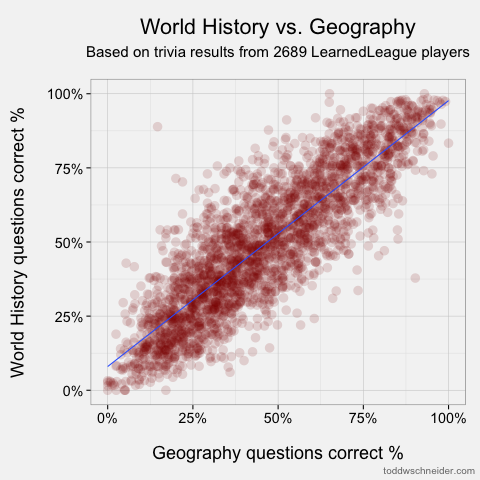
- Geography & World History, ρ = 0.860
- Film & Television, ρ = 0.803
- American History & World History, ρ = 0.802
- Art & Literature, ρ = 0.795
- Geography & Language, ρ = 0.773
And the categories with the lowest correlation:
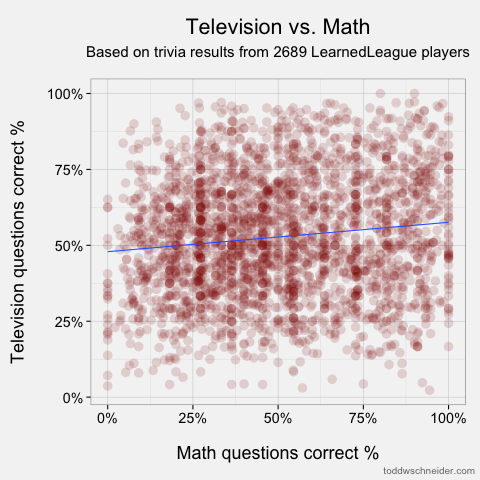
- Math & Television, ρ = 0.126
- Math & Theatre, ρ = 0.135
- Math & Pop Music, ρ = 0.137
- Math & Film, ρ = 0.148
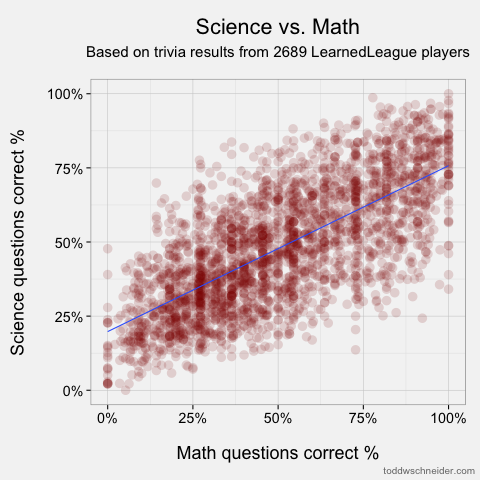
- Math & Art, ρ = 0.256
The scatterplots of the most and least correlated pairs look as follows. Each dot represents one player, and I’ve added linear regression trendlines:
Most correlated: geography and world history
Least correlated: math and television
The full list of 153 correlations is available in this Google spreadsheet. At first I was a bit surprised to see that every category pair showed a positive correlation, but upon further reflection it shouldn’t be that surprising: some people are just better at trivia, and they’ll tend to do well in all categories (none other than Ken Jennings himself is an active LLama!).
The most correlated pairs make some intuitive sense, though we should always be wary of hindsight bias. Still, it’s pretty easy to tell believable stories about the highest correlations: people who know a lot about world history probably know where places are (i.e. geography), people who watch TV also watch movies, and so on. I must say, though, that the low correlation between knowledge of math and the pop culture categories of TV, theatre, pop music, and film doesn’t do much to dispel mathematicians’ reclusive images! The only category that math shows an above-average correlation to is science, so perhaps it’s true that mathematicians just live off in their own world?
You can view a scatterplot for any pair of categories by selecting them from the menus below. There’s also a bar graph that ranks the other categories by their correlation to your chosen category:

Predicting gender from trivia category performance
LLamas optionally provide a bit of demographic information, including gender, location, and college(s) attended. It’s not lost on me that my category performance is pretty stereotypically “male.” For better or worse, my top 3 categories—business, math, and sports—are often thought of as male-dominated fields. That got me to wondering: does performance across categories predict gender?
It’s important to note that LearnedLeague members are a highly self-selected bunch, and in no way representative of the population at large. It would be wrong to extrapolate from LearnedLeague results to make a broader statement about how men and women differ in their trivia knowledge. At the same time, predictive analysis can be fun, so I used R’s rpart package to train a recursive partitioning decision tree model which predicts a player’s gender based on category statistics. Recursive partitioning trees are known to have a tendency to overfit data, so I used R’s prune() function to snip off some of the less important splits from the full tree model:

The labels on each leaf node report the actual fraction of the predicted gender in that bucket. For example, following from the top of the tree to the right: of the players who got at least 42% of their games/sport questions correct, and less than 66% of their theatre questions correct, 85% were male
The decision tree uses only 4 of the 18 categories available to it: games/sport, theatre, math, and food/drink, suggesting that these are the most important categories for predicting gender. Better performance in games/sport and math makes a player more likely to be male, while better performance in theatre and food/drink makes a player more likely to be female.
How accurate is the decision tree model?
The dataset includes 2,093 males and 595 females, and the model correctly categorizes gender for 2,060 of them, giving an overall accuracy rate of 77%. Note that there are more males in the dataset than there are correct predictions from the model, so in fact the ultra-naive model of “always guess male” would actually achieve a higher overall accuracy rate than the decision tree. However, as noted in this review of decision trees, “such a model would be literally accurate but practically worthless.” In order to avoid this pitfall, I manually assigned prior probabilities of 50% each to male and female. This ensures that the decision tree makes an equal effort to predict male and female genders, rather than spending most of its effort getting all of the males correct, which would maximize the number of total correct predictions.
With the equal priors assigned, the model correctly predicts gender for 75% of the males and 82% of the females. Here’s the table of actual and predicted gender counts:
| Predicted Male | Predicted Female | Total | |
| Actual Male | 1,570 | 523 | 2,093 |
| Actual Female | 105 | 490 | 595 |
| Total | 1,675 | 1,013 | 2,688 |
Ranking the categories by gender preference
Another way to think about the categories’ relationship with gender is to calculate what I’ll call a “gender preference” for each category. The methodology for a single category is:
-
Take each player’s performance in that category and adjust it by the player’s overall correct rate
- E.g. the % of math questions I get correct minus the % of all questions I get correct
- Calculate the average of this value for each gender
- Take the difference between the male average and the female average
- The result is the category’s (male-female) preference, where a positive number indicates male preference, and a negative number indicates female preference
Calculating this number for each category produces a relatively easy to interpret graph that ranks categories from most “feminine” to “masculine”:
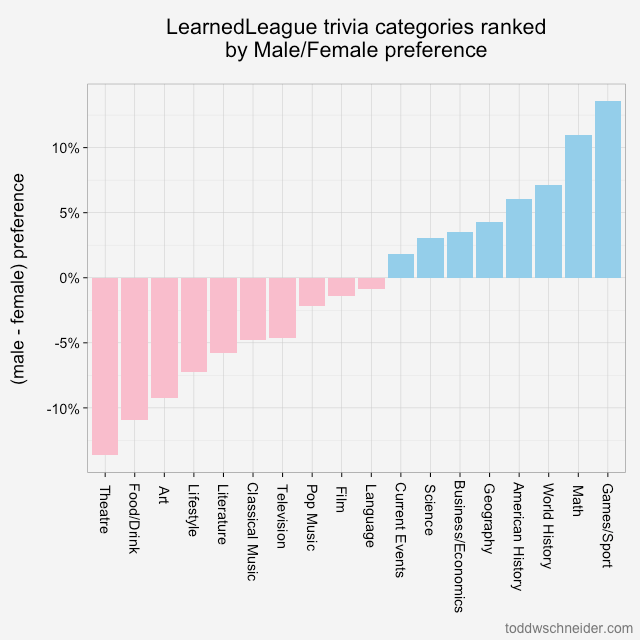
The chart shows the difference between men and women’s average relative performance for each category. For example, women average 8.1% higher correct rate in theatre compared to their overall correct rate, and men average 5.5% worse correct rate in theatre compared to their overall average, so the difference is (-5.5 - 8.1) = -13.6%
Similar to the results from the decision tree, this methodology shows that theatre and food/drink are most indicative of female players, while games/sport and math are most associated with male players.
Data
The dataset and scripts I used for this post are available on GitHub. If you’re interested in LearnedLeague, this article provides a good overview, and you can always try your hand at a random selection of sample questions.